Americans waste a full work week each year just sitting in their cars going nowhere. That’s 43 hours of your life annually 😵, costing the average driver $771 in lost time and productivity.
The worst offenders? New York and Chicago, where drivers lose a whopping 102 hours yearly to gridlock.
Traffic isn’t just annoying-it’s expensive. Nationwide, congestion costs Americans $74 billion annually in wasted time.
1. New York City, New York

New York tops the list as America’s most congested city. Drivers here lose a staggering 102 hours per year stuck in traffic, costing an average of $1,826 in lost time and productivity.
The Big Apple’s average travel time is nearly 25 minutes to cover just 10 kilometers, with downtown speeds crawling at just 13 mph.
That’s why so many New Yorkers opt for the subway instead!
Why It’s On This List: New York ranks 20th globally for traffic congestion with a 43% congestion level, making it America’s undisputed traffic champion.
2. Chicago, Illinois

Chicago ties with NYC at 102 hours lost annually to traffic jams. The Windy City saw a 6% increase in congestion from 2023.
Drivers here spend almost 18 minutes traveling just 10 kilometers, with downtown speeds averaging only 14 mph.
You’re better off planning extra travel time if you’re heading into the Loop during rush hour.
Congestion Cost: Traffic jams cost Chicago drivers $1,826 annually and the city economy a whopping $6.6 billion in lost productivity.
3. Los Angeles, California

LA might be infamous for its traffic, but it actually ranks third with 88 hours lost annually. This car-dependent metropolis saw a slight 1% decrease in congestion from 2023.
Despite its reputation, downtown LA maintains a relatively better 22 mph average speed compared to other top congested cities.
But here’s the catch – LA’s sprawling highway system still costs drivers $1,575 annually in wasted time.
Traffic Impact: LA’s traffic congestion costs the city economy $8.5 billion annually, making it one of the most economically impacted cities.
4. Boston, Massachusetts

Boston drivers lost 79 hours to traffic in 2024, showing a 10% improvement from 2023. The city’s narrow, winding streets contribute to its congestion problems.
With downtown speeds averaging just 13 mph and travel times of over 19 minutes per 10 kilometers, Boston’s colonial-era street layout wasn’t designed for modern traffic.
That’s why the Big Dig project was one of America’s most expensive infrastructure projects ever.
Congestion Level: Boston has a 41% congestion level, ranking it 97th globally for traffic problems.
5. Philadelphia, Pennsylvania

Philadelphia saw a 12% increase in traffic congestion, with drivers losing 77 hours annually. The City of Brotherly Love isn’t showing much love to commuters.
Downtown speeds average just 14 mph, and the city’s congestion costs drivers $1,378 each year.
I made a classic mistake thinking Philly traffic would be better than NYC – it’s almost as bad!
Economic Impact: Philadelphia’s traffic jams cost the city economy $3.3 billion annually in lost productivity.
6. Miami, Florida

Miami drivers lost 74 hours to traffic in 2024, a 6% increase from the previous year. The city’s booming population and tourism contribute to its growing congestion.
With downtown speeds averaging 20 mph and a 41% congestion level, Miami’s beautiful weather comes with a traffic price tag.
Want me to share a shocking fact? Miami’s traffic costs each driver $1,325 annually in wasted time.
Tourist Factor: Miami’s seasonal tourism surges create unpredictable traffic patterns that frustrate year-round residents.
7. Houston, Texas

Everything’s bigger in Texas, including traffic jams. Houston drivers lost 66 hours to congestion in 2024, a 6% increase from 2023.
With downtown speeds of just 17 mph and sprawling highways, Houston’s car-dependent culture contributes to its ranking.
The city’s rapid growth has outpaced its infrastructure development, leaving commuters stuck in traffic.
Economic Cost: Houston’s traffic congestion costs the city economy $3.5 billion annually, one of the highest total costs in America.
8. Atlanta, Georgia

Atlanta drivers spent 65 hours stuck in traffic in 2024, a 7% increase from the previous year. The city’s infamous “Spaghetti Junction” interchange is a daily nightmare for commuters.
With downtown speeds averaging 18 mph and limited public transit options, Atlanta’s traffic problems continue to worsen.
But here’s the deal – Atlanta’s sprawling suburban development pattern makes traffic solutions particularly challenging.
Commuter Challenge: Atlanta’s metro area spans nearly 8,400 square miles, creating some of the longest average commute distances in America.
9. Washington, D.C.

Our nation’s capital saw a slight improvement with drivers losing 62 hours to traffic in 2024, down 2% from 2023. But D.C. still ranks second for average travel time at 21 minutes per 10 kilometers.
With the slowest downtown speeds on the list at just 12 mph, political gridlock isn’t the only thing moving slowly in Washington.
You’re better off taking the Metro if you’re heading into downtown D.C. during rush hour.
Global Ranking: Washington D.C. ranks 55th worldwide for traffic congestion, with a 36% congestion level.
10. Seattle, Washington

Seattle rounds out the top 10 with drivers losing 63 hours annually to traffic, a 9% increase from 2023. The city’s geography of water bodies and limited bridges creates natural bottlenecks.
Downtown speeds average 18 mph, and Seattle’s tech boom has brought thousands of new residents without proportional infrastructure improvements.
That’s why the city has been investing heavily in light rail expansion to offer alternatives to driving.
Growing Problem: Seattle saw one of the largest year-over-year increases in congestion (9%) among the top 10 worst traffic cities.
11. San Francisco, California

San Francisco ranks high for traffic congestion with drivers spending an average of 20 minutes and 30 seconds to travel just 10 kilometers. The city’s hilly terrain and limited bridge access points create natural bottlenecks.
With a congestion level of 38%, San Francisco drivers lose about 75 hours annually stuck in traffic.
But here’s the catch – the tech industry’s return to office has significantly increased traffic compared to pandemic levels.
Global Standing: San Francisco ranks 71st worldwide for traffic congestion, making it one of America’s most gridlocked cities.
12. San Jose, California

Silicon Valley’s hub saw significant traffic increases as tech companies called workers back to offices. The average travel time here is notably high for a mid-sized city.
San Jose’s limited public transit options and sprawling tech campuses contribute to its traffic woes.
That’s why many tech companies now operate private shuttle services for their employees.
Tech Impact: San Jose’s traffic patterns directly correlate with major tech companies’ work-from-home policies, showing dramatic increases as offices reopened.
13. Denver, Colorado

Denver experienced the nation’s largest traffic increase at a whopping 19% jump from 2023. The Mile High City’s rapid population growth has outpaced its infrastructure development.
The city’s mountain backdrop limits expansion options, creating natural choke points for commuters.
You’re better off planning extra time if traveling during Denver’s increasingly lengthy rush hours.
Rapid Growth: Denver’s 19% year-over-year traffic increase was the highest among all major U.S. cities, reflecting its booming population.
14. Baltimore, Maryland

Baltimore’s aging infrastructure contributes significantly to its traffic problems. The city’s harbor creates natural bottlenecks with limited crossing options.
Drivers here face longer commute times than many comparable-sized cities, with downtown speeds averaging just 15 mph.
I made a classic mistake thinking Baltimore’s traffic would be better than nearby D.C. – it’s nearly as challenging.
Infrastructure Challenge: Baltimore’s aging tunnels and bridges create severe bottlenecks during rush hour, with some infrastructure dating back to the 1950s.
15. Portland, Oregon

Portland’s reputation for environmental consciousness hasn’t saved it from significant traffic congestion. The city’s limited river crossings create natural choke points.
Despite extensive bike lanes and public transit, Portland drivers still face substantial delays during peak hours.
But here’s the deal – Portland’s traffic actually improves during rainy weather as more commuters opt for public transit.
Bridge Factor: Portland’s Willamette River crossings create some of the worst bottlenecks in the Pacific Northwest, with bridge lifts adding unpredictable delays.
16. Minneapolis, Minnesota

Minneapolis drivers face unique challenges with severe winter weather adding unpredictability to commute times. The Twin Cities’ sprawling suburban development pattern contributes to congestion.
Despite an extensive highway system, Minneapolis commuters lose significant time during rush hours.
Want me to share something surprising? Minneapolis traffic actually worsens in summer due to extensive road construction during the brief warm season.
Seasonal Impact: Minneapolis traffic patterns show dramatic seasonal variations, with winter storms and summer construction creating dual peak congestion periods.
17. New Orleans, Louisiana
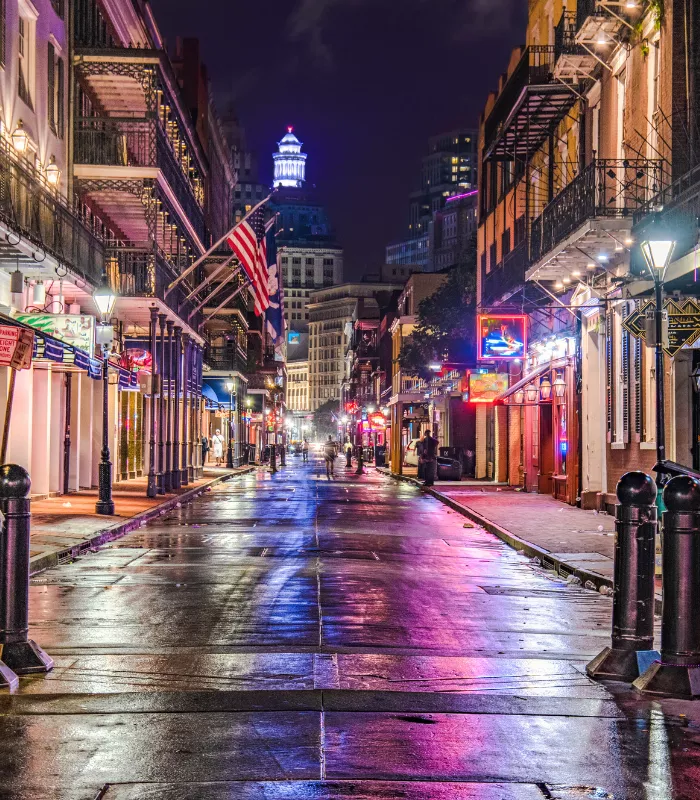
New Orleans’ unique geography creates natural traffic challenges with limited crossing options over the Mississippi River. The city loses about 40 hours annually to traffic congestion.
With an average travel time of 13 minutes and 10 seconds per 10 kilometers, the Big Easy isn’t so easy for drivers.
That’s why locals know to avoid driving during Mardi Gras and other major festivals.
Festival Factor: New Orleans experiences dramatic traffic spikes during its 60+ annual festivals, with Mardi Gras creating the worst congestion of the year.
18. Las Vegas, Nevada
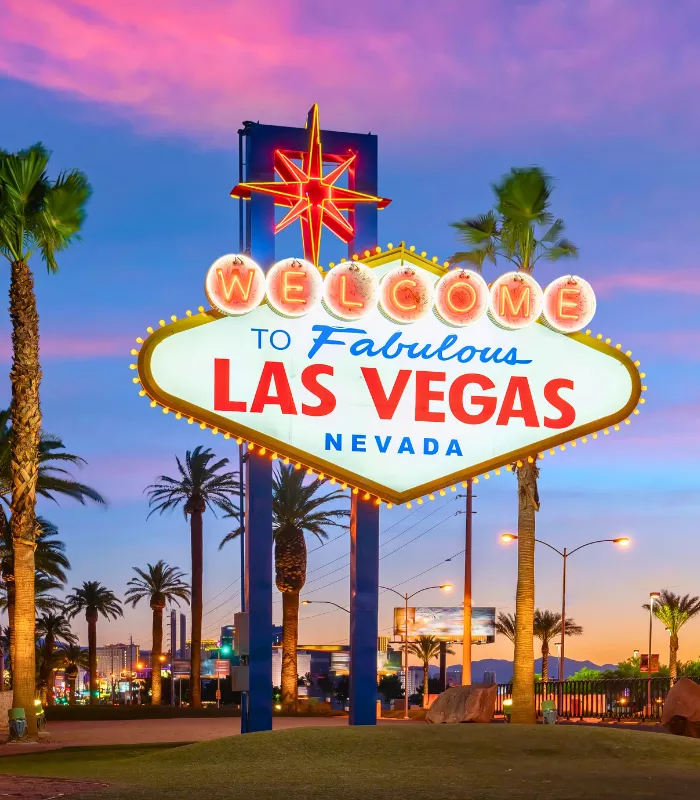
Las Vegas ranks 299th globally for traffic congestion, with drivers losing 32 hours annually. The Strip creates a unique traffic environment unlike any other American city.
With average speeds of 41 km/h during rush hour, Las Vegas traffic moves relatively well compared to other major cities.
But here’s the catch – weekend traffic often exceeds weekday rush hours due to tourism patterns.
Tourist Impact: Las Vegas experiences unique traffic patterns with Friday and Saturday nights often more congested than traditional weekday rush hours.
19. Providence, Rhode Island

Providence ranks 305th globally for traffic congestion, with drivers losing 41 hours annually to traffic. The city’s colonial-era street layout wasn’t designed for modern traffic volumes.
With average travel times of 12 minutes and 50 seconds per 10 kilometers, Providence drivers face significant delays.
You’re better off avoiding I-95 during rush hour if you’re passing through this New England city.
Historical Challenge: Providence’s 17th-century street grid creates some of the most challenging navigation for modern drivers in any American city.
20. Milwaukee, Wisconsin

Milwaukee rounds out our extended list with drivers losing 32 hours annually to traffic congestion. The city ranks 309th globally with a congestion level of 18%.
With average speeds of 41 km/h during rush hour, Milwaukee traffic moves relatively well compared to other major cities.
I made a classic mistake underestimating Milwaukee’s traffic – its lakefront location creates natural bottlenecks that can surprise visitors.
Lake Effect: Milwaukee’s position on Lake Michigan creates a unique traffic pattern with all routes funneled away from the shoreline, creating natural congestion points.